A better way to explore TCGA data
If you work in cancer biomarker and target research, chances are you use data from The Cancer Genome Atlas (TCGA) to help you make discoveries. This comprehensive and coordinated effort helps accelerate our understanding of the molecular causes of cancer through genomic analyses, including large-scale genome sequencing. TCGA covers 33 types of cancer with multi-omics data, such as RNA-seq, DNA-seq, copy number, microRNA-seq, and others. Detailed analyses of individual TCGA datasets, as well as pan-cancer meta-analysis, have revealed new cancer subtypes with important therapeutic implications. A key value here is the TCGA metadata. TCGA samples include extensive clinical metadata for diverse cancers. However, inconsistent terminology and formatting limit the utility of these data for pan-cancer analyses.
TCGA data within QIAGEN OmicSoft OncoLand is rigorously curated by experts who apply extensive ontologies and formatting rules to maximize consistency. This allows researchers to more easily find and understand patient characteristics, discover related covariates and explore patterns of clinical parameters across cancers in the context of multi-omics data. QIAGEN OmicSoft established strict standards through our curation of over 600,000 disease-relevant ‘omics samples. QIAGEN OmicSoft Lands provide access to uniformly processed datasets, in-depth metadata curation, and data exploration tools that enable quick insights from thousands of deeply-curated ‘omics studies across therapeutic areas. QIAGEN OmicSoft Lands centralize data from Gene Expression Omnibus (GEO), NCBI Sequence Read Archive (SRA), ArrayExpress, TCGA, Cancer Cell Line Encyclopedia (CCLE), Genotype-Tissue Expression (GTEx), Blueprint, International Cancer Genome Consortium (ICGC), Therapeutically Applicable Research to Generate Effective Treatments (TARGET) and others.

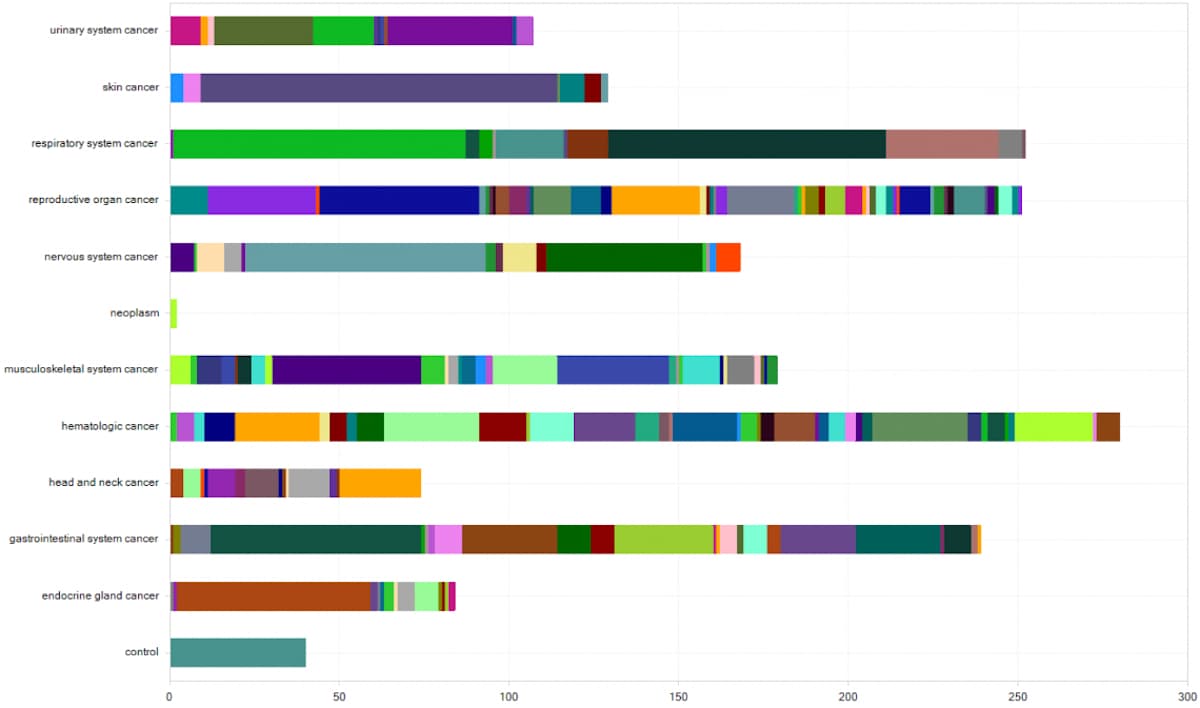
Figure 1. QIAGEN OmicSoft OncoLand collects and integrates datasets not only from TCGA but also from many other public data sources such as Cancer Cell Line Encyclopedia (CCLE), Blueprint, Genotype-Tissue Expression (GTEx), TRAcking Cancer Evolution through therapy (TRACERx), and many more. Here you see the distribution of recently-added samples grouped on the y-axis by DiseaseCategory and subgrouped by CancerType.
OmicSoft’s curation process for TCGA
To give you an idea of the extensive time and care QIAGEN curators invest in manual curation of public ‘omics data, they recently spent over 1400 hours performing a comprehensive update of TCGA metadata within QIAGEN OmicSoft OncoLand, reviewing over 1200 source files. Clinical metadata are now comprehensively documented to clarify the meaning of fields in alignment with the latest OmicSoft curation standards. When TCGA metadata fields are redundant or unclear, new field names are used to clarify the meaning. In addition, new metadata from recent TCGA publications are matched to TCGA data to apply recent discoveries about molecularly defined cancer subtypes.

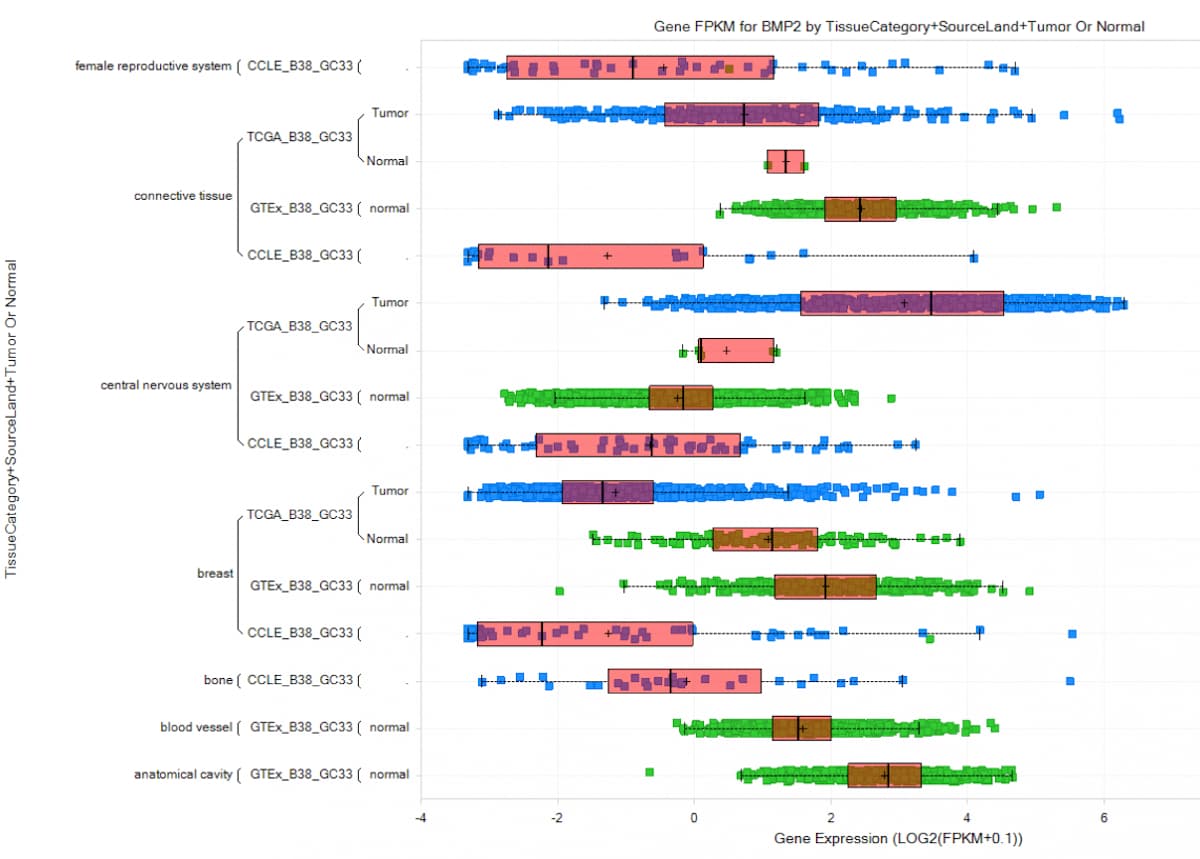
Figure 2. Example of a QIAGEN OmicSoft query and visualization: BMP2 expression in tissue samples from CCLE, GTEx, and TCGA, using the latest Human.B38/Gencode.V33 releases. The y-axis is profiled on TissueCategory, SourceLand, and Tumor or Normal.
At the core of the OmicSoft curation process, curators apply scientific expertise, controlled vocabulary, and standardized formatting to all applicable metadata, either as a Fully Controlled Field (key clinical parameters use terms from QIAGEN-defined ontologies) or a Format Controlled Field (where a QIAGEN OmicSoft ontology is not applicable, terms are formatted consistently to maximize uniformity from semi-structured data). This means you can quickly and easily find all applicable samples using simplified search criteria.
Unification of related TCGA metadata fields
With data submissions from dozens of labs, groups adopt inconsistent standards to represent the same data. Where possible, OmicSoft curators identified hundreds of columns containing the same information for various tumors and combined the data into unified columns to enhance pan-cancer analyses and computational analysis. As an example, the cancer diagnosis of a first-degree family member with a history of cancer was captured in TCGA across five fields from four cancers; QIAGEN OmicSoft TCGA curation unites these into the single field “Family History [Cancer] [Type]”.

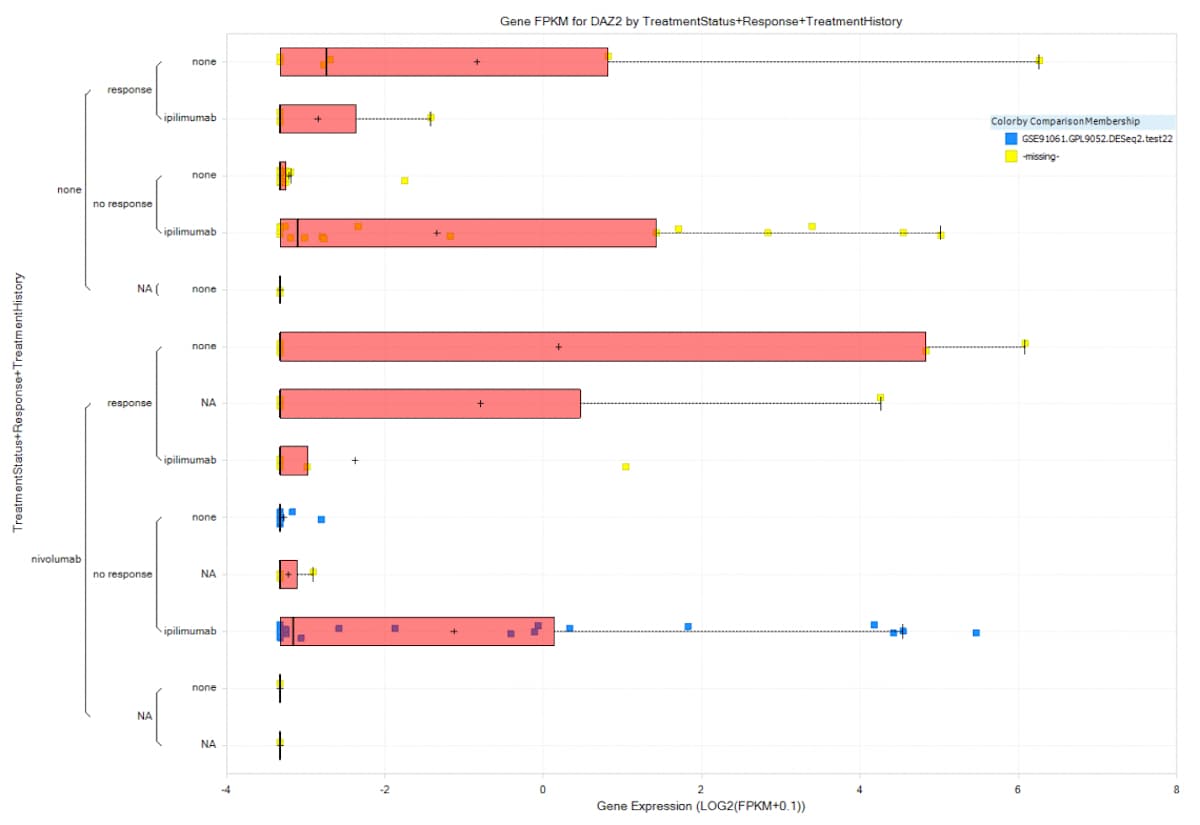
Figure 3. QIAGEN OmicSoft provides over 100,000 statistical comparisons of the curated data. Here you can see the expression of DAZ2 grouped by TreatmentStatus+Response+TreatmentHistory. Samples included are the comparison contrast of TreatmentHistory: ipilimumab vs. none in TreatmentStatus: nivolumab and Response: none colored blue.
Synonymous terms and typographical errors
QIAGEN OmicSoft manually applies extensive treatment ontologies to ensure proper and unambiguous labeling of samples with treatment terms. Because of the many submitting groups, different standards were used for well-established terms, such as drug and radiation treatments, with occasional typos escaping submitter quality control checks. For example, over 20 different terms were used to describe treatment with doxorubicin!
Want to learn more about how you can boost your TCGA exploration to get quicker and more meaningful insights?
Read our white paper to get the full details of how QIAGEN OmicSoft OncoLand helps boost TCGA exploration. Download our unique and comprehensive metadata dictionary of clinical covariates to quickly discover the meaning of over 1000 relevant fields for deeper TCGA data exploration across cancers.
Learn more about the costs of free data in our industry report. Check out our infographic that details the various QIAGEN OmicSoft software tools for integrated ‘omics data, to see which solutions should help you transform your biomarker and target discovery.