2019 Trinity Drug Index Evaluates Actual Commercial Performance of Novel Drugs Approved in 2016
Fewer Approvals, but Neurology Rivals Oncology and Sees Major Innovations
This report, the fourth in our Trinity Drug Index series, outlines key themes and emerging trends in the industry as we progress towards a new world of targeted and innovative products. It provides a comprehensive evaluation of the performance of novel drugs approved by the FDA in 2016, scoring each on its commercial performance, therapeutic value, and R&D investment (Table 1: Drug ranking – Ratings on a 1-5 scale).
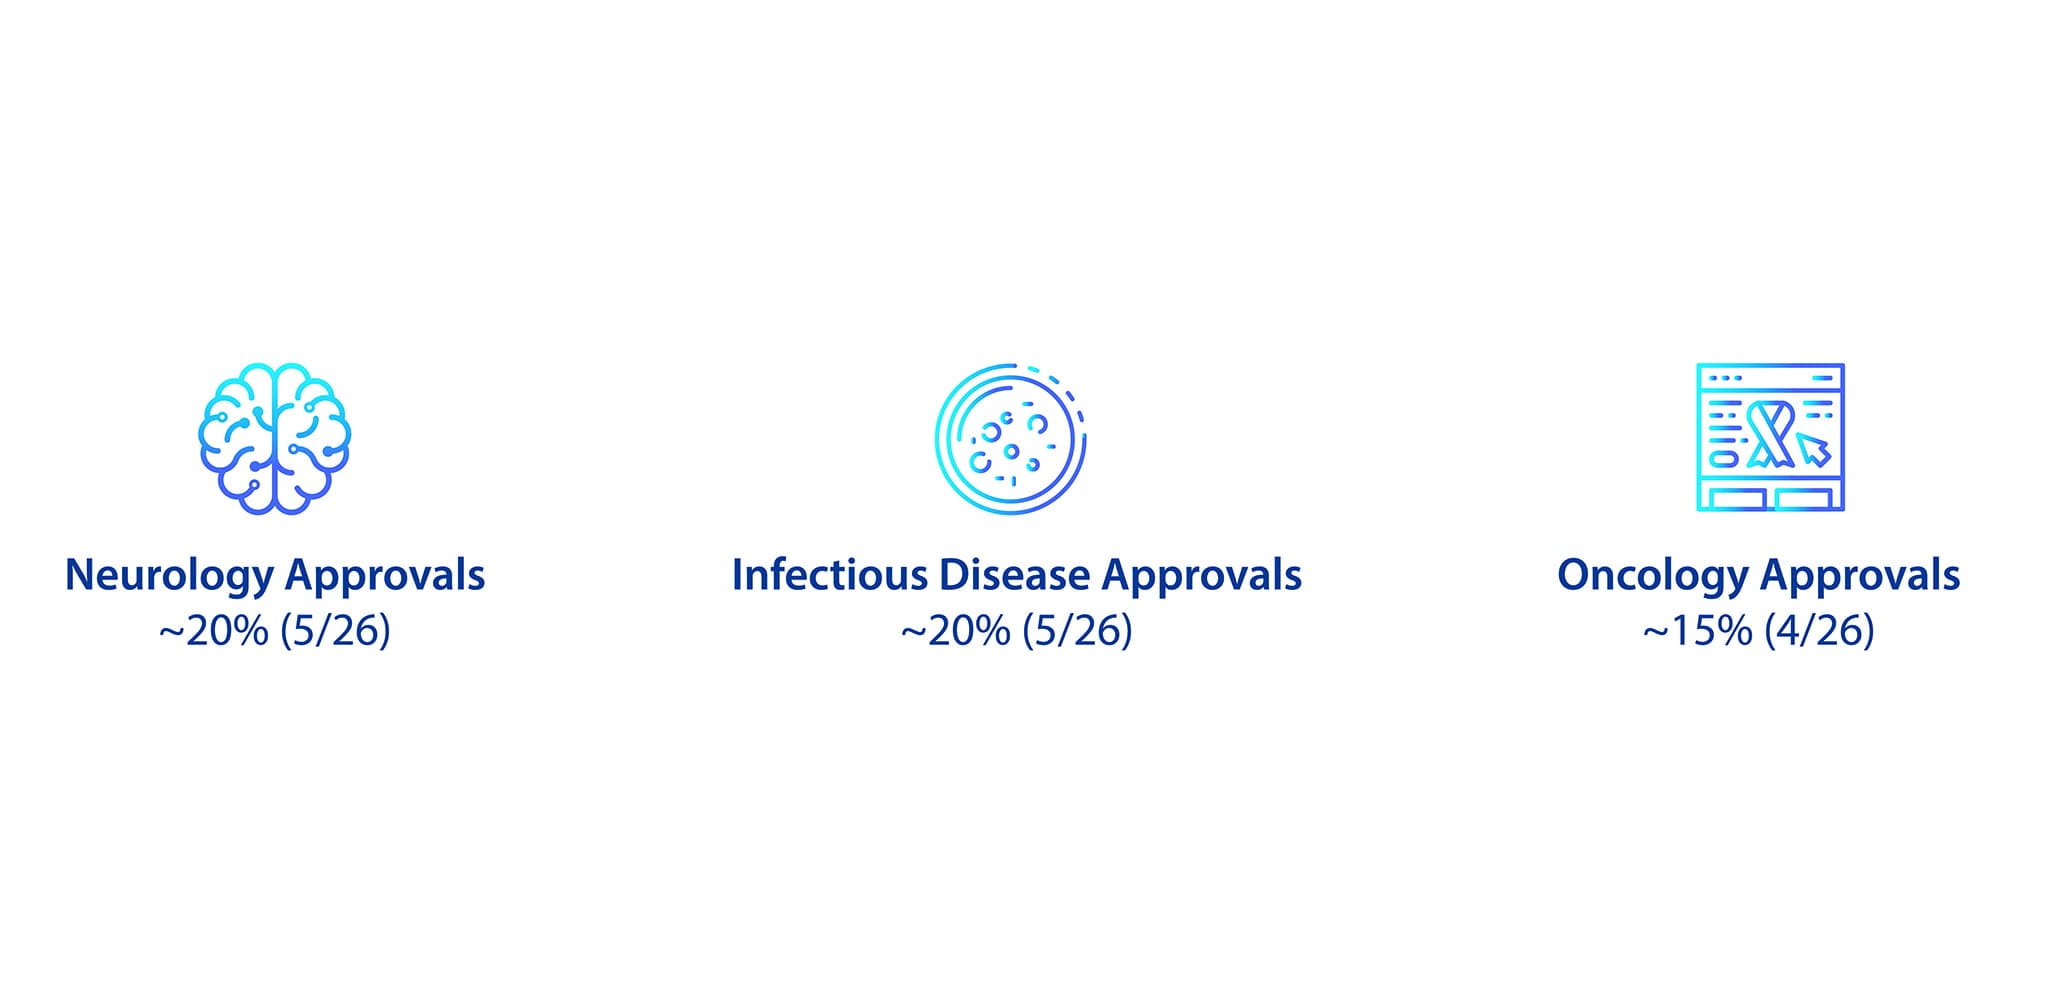
Although only 26 unique therapeutic agents approved by CDER and CBER (Centers for Drug and Biologics Evaluation & Research) in 2016 were profiled in this Index, compared to the 50+ profiled in the Trinity Drug Index reports for the two previous years, the approvals signaled key trends. Of the 26, half were biologic products, including novel nucleic acid and cell-based therapies. In addition, neurology approvals represented ~20% of the total, while metabolic and oncology each accounted for 15% of total approvals. By comparison, oncology drugs represented 30% of approvals in 2015, according to the 2018 Trinity Drug Index.
Key themes and emerging trends across the industry, including the relative increase in neurology products as a percentage of total approvals, are highlighted in the 2019 Trinity Drug Index. To view the full article, click here