Biopharmaceutical Dealmakers’ Intentions in 2018: Bullish Run to Continue Amidst Signs of Greater Risk Aversion
By Neel Patel and Sachin Purwar
Retrospective data on dealmaking in the biopharmaceutical industry is fairly easy to access from a number of sources. Crystal balls are harder to come by, but the Dealmakers’ Intentions Study, conducted by Syneos Health Consulting each year for the last 10 years, comes close. As the only forward-looking measure of dealmaking in the industry, the study provides a review of biopharmaceutical dealmakers’ intentions around licensing and acquisitions for the next twelve months and identifies areas of greatest opportunity – and potential pitfalls – for buyers and sellers.
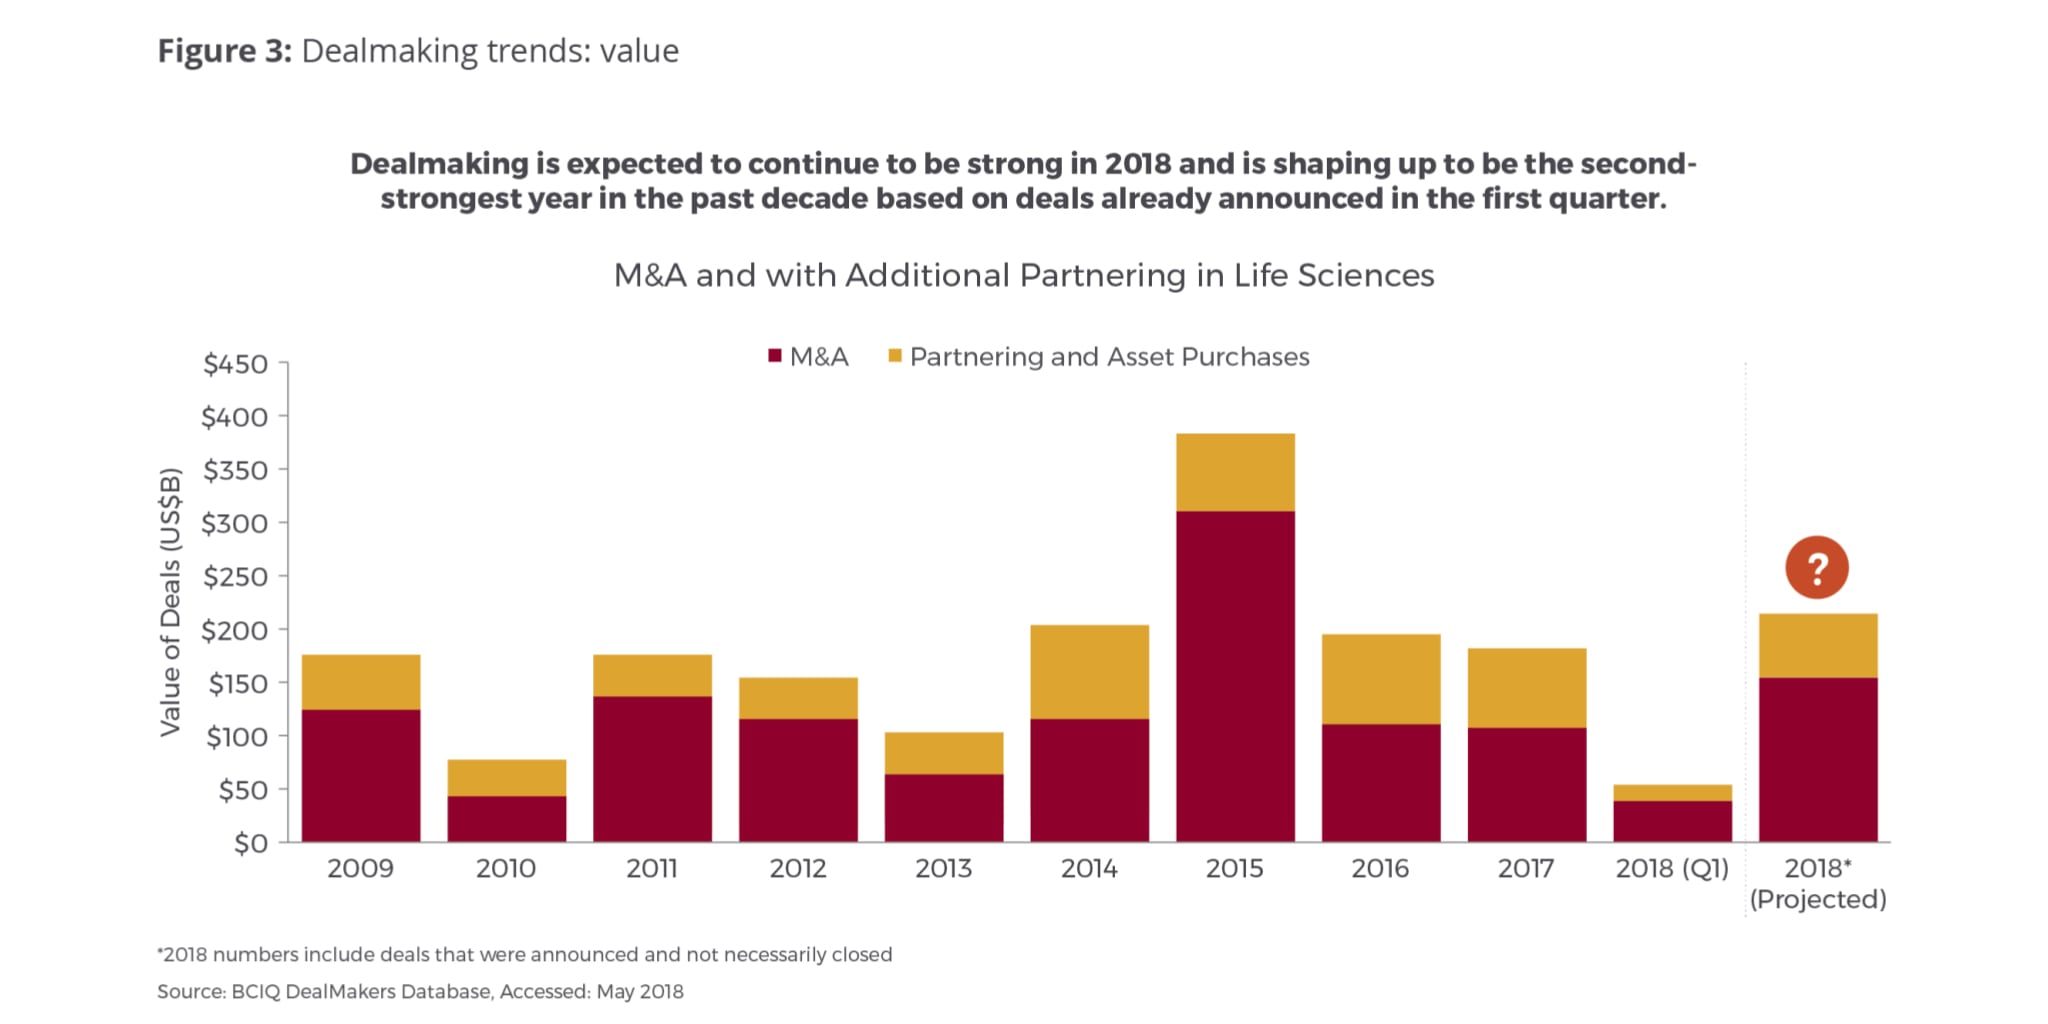
Based on this year’s study, we predict that dealmaking value (M&A and partnering) could reach $200-$300 billion in 2018 – the second highest level in a decade, although still only about 60 percent of the record level seen in 2015 (Fig. 3). This acceleration in dealmaking is an indication not just of the money flooding the system—thanks to a robust financing environment, tax reform in the U.S. and the expected repatriation of significant funds from overseas, which is an episodic bump likely to have ripple effects into 2019 as well—but also reflects a thirst for innovation as companies seek to replenish depleted pipelines, strengthen their positions in targeted therapeutic areas, and race to stay ahead of the technology curve.
Read the full study findings.

To gain more insight into what the rest of 2018 holds, Syneos HealthTM surveyed dealmakers across the industry to assess their intentions for the next 12 months and put these findings into context for the year ahead. This year, we surveyed 66 members of the biopharmaceutical community who participate on either or both sides of deals and who are predominantly executive-level influencers on decision-making. The 2018 Dealmakers’ Intentions Study, the 10th in our series, captures their expectations for deal activity, supply and demand for specific assets at different development stages, and various factors affecting dealmaking. In this article, we discuss high-level dealmaking trends for 2018, expectations by deal type, and factors indicating buyers are becoming a bit more selective about the assets they are pursuing and more risk averse.
IPOs vs. Venture Financing in 2018
The initial public offering (IPO) landscape is projected to be around the average of the five-year trend, with expected volume of just over $2.5 billion. Although IPO volume is not expected to reach the level we saw in 2017, this year is shaping up to be a relatively strong environment compared to historical standards.
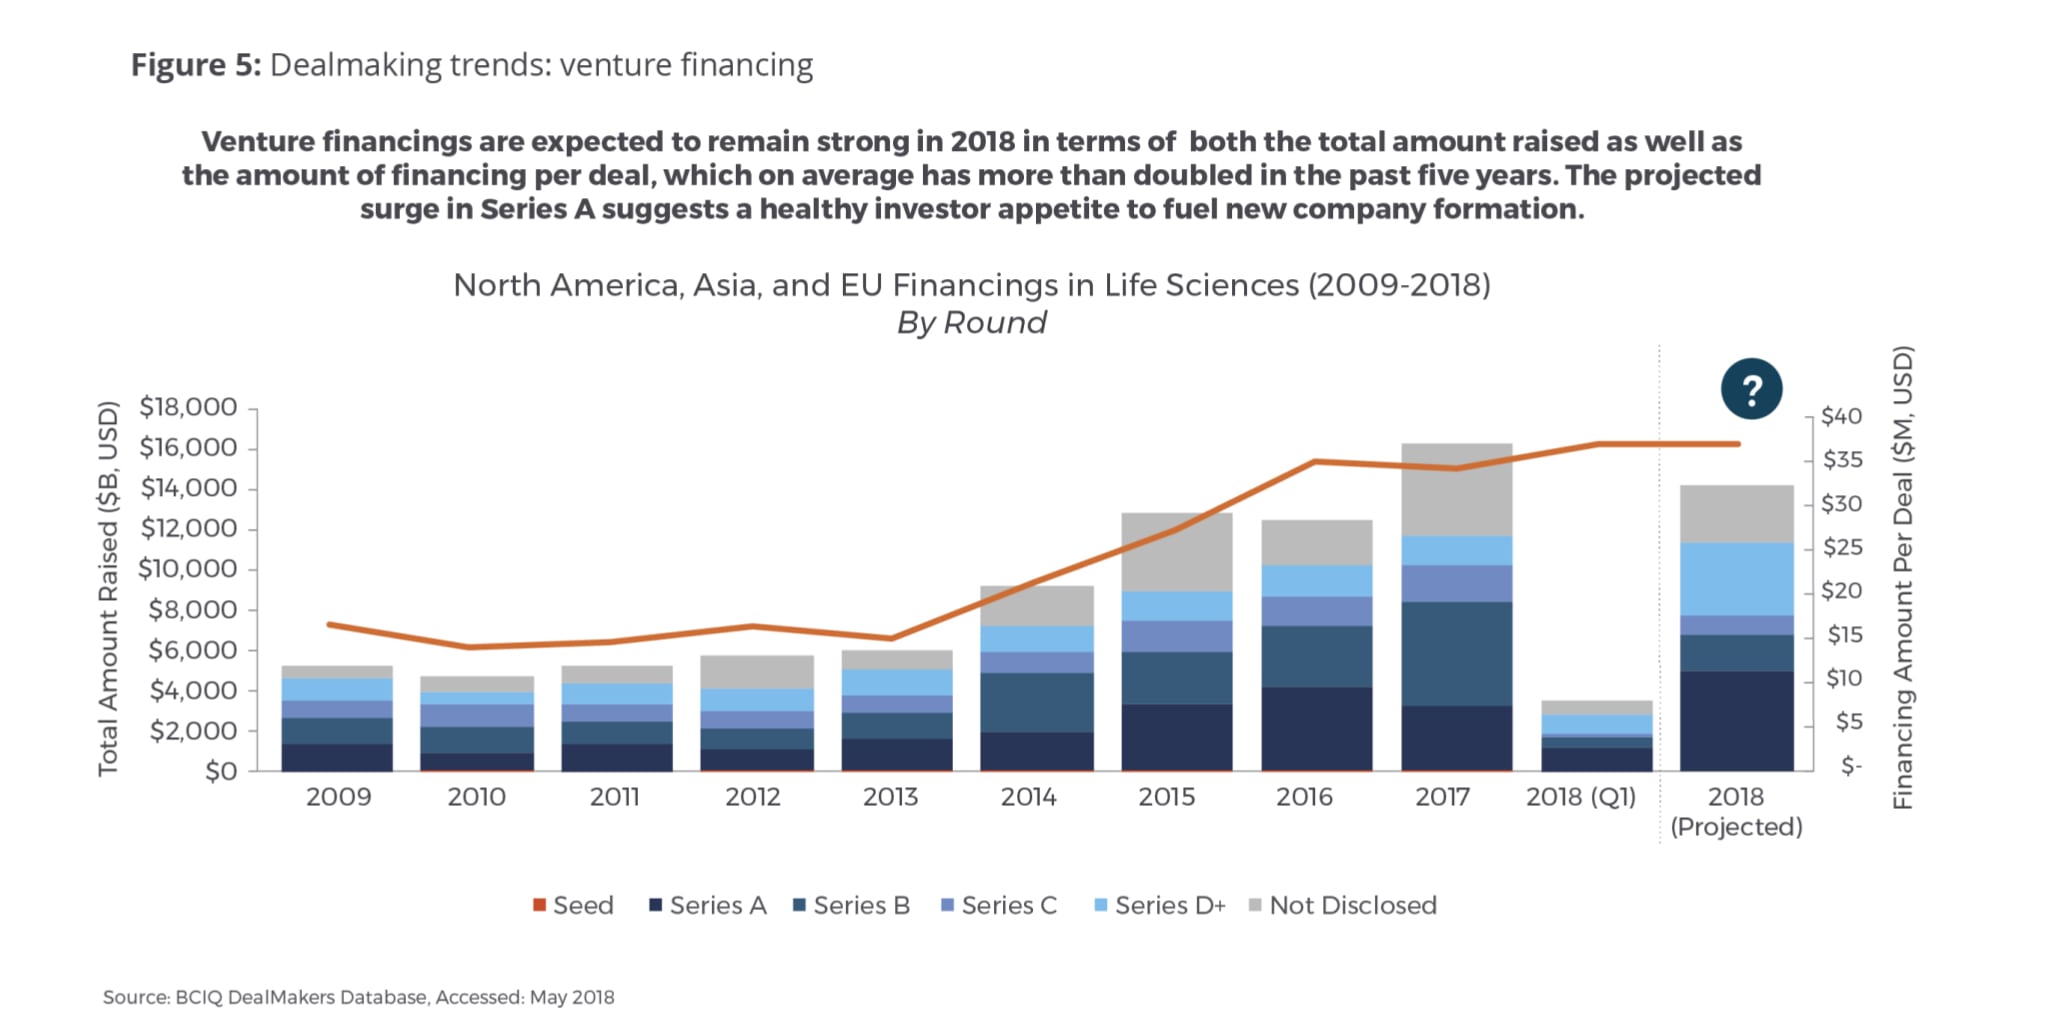
In contrast, venture financing in the life sciences has witnessed a bull market run that started in 2014 and resulted more than doubling in annual venture financings in 2015-2017 versus the historical average in 2009-2014 (Fig. 5). Additionally, we are seeing a greater amount of funding per individual venture financing deal, which has more than doubled across all venture investments in life sciences when you compare the average of 2009-2013 versus 2014-2017. Based on Q1 2018 numbers, 2018 venture financing is on pace to reach $10-11 billion, which will put it just behind the unprecedented ~$12 billion that we saw in the peak in 2017. In particular, Series A financing stands out as it is expected to see more than 80 percent growth in 2018 (similar to the jump from 2014-2016). The increase in Series A financing indicates a robust investor appetite to fuel new company formation that is likely the result of the exit opportunities in life sciences created through M&A and partners in the last few years. A large increase in Series D+ indicates that many companies are opting to stay private longer to avoid an IPO and develop their pipeline to more meaningful value inflection points or commercialize themselves.

Signs of Greater Risk Aversion
Overall, there is a strong consensus among buyers and sellers that dealmaking will either increase or stay the same. Both groups expect about the same level of outright acquisitions. However, buyers are more optimistic than sellers that there will be an increase in traditional licensing/partnership deals in 2018. This is in spite of an expected increase in deal flow and a potential increase in capital thanks to repatriation and favorable tax law changes, which may suggest that an offset of risk is coming back into play.
In addition, for 2018 we are seeing a greater parity in the discount rate between buyer and seller (both 17 percent) compared to the 4 percent spread we saw in 2017. This shrinking gap in discount rates may be the result of the bull market in private financings. It could suggest an increase in partnerships as opposed to outright acquisitions as sellers assign higher valuations to their assets compared to 2017, and buyers will look to structure deals where the seller participates in some of the risk. It may also suggest that not enough value is being created for buyers through the transaction from a straight revenue perspective and they will have to be more reliant on synergies with existing capabilities. With discount rates at parity, in-licensers and out-licensers will need to have similar commercial expectations for an asset in order to align on overall value as there may be less flexibility around negotiation. Given our hypothesis last year that a wider spread leads to increased activity in the following year (which early expectations for 2018 are showing to be the case), this year’s parity may also be an indicator of a slowdown in activity in 2019.
Deals Getting Harder to Close
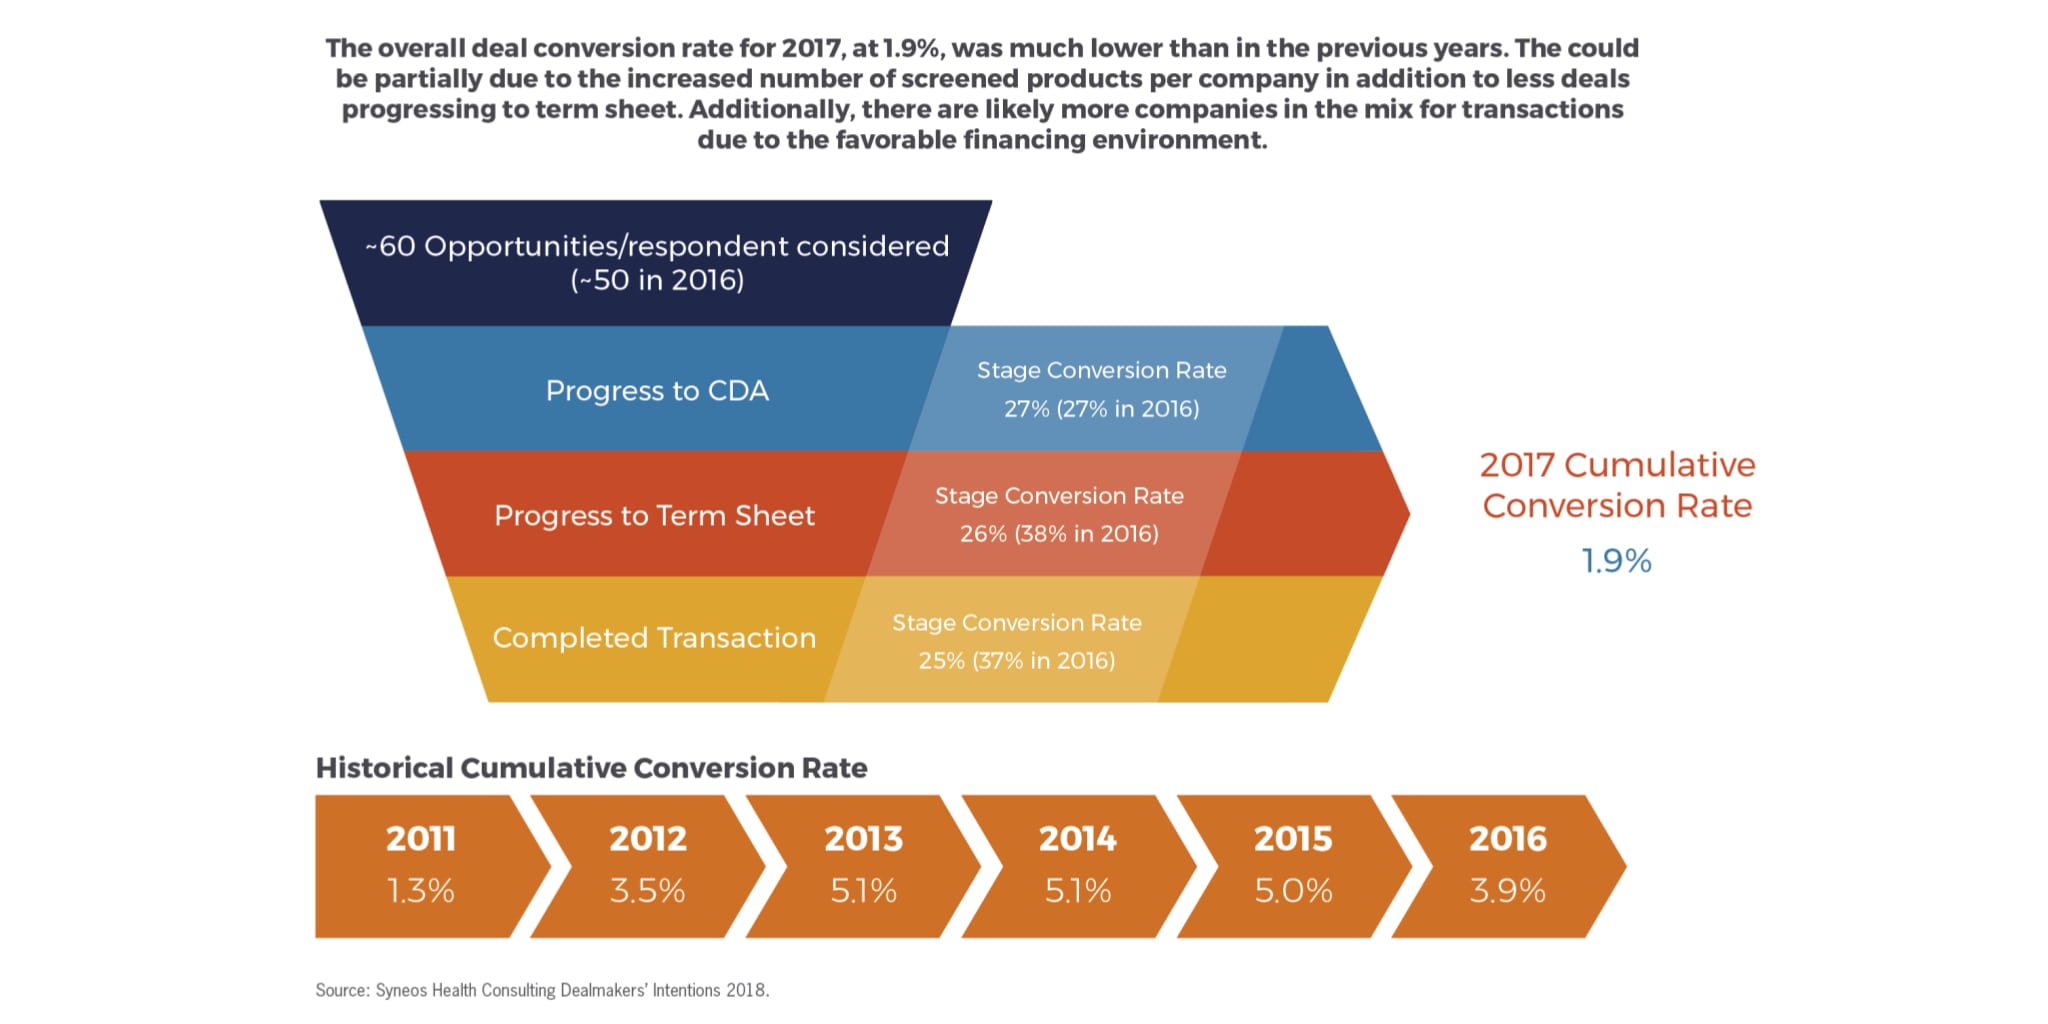
Another factor signaling that buyers are becoming a bit more selective about the assets they are pursuing and a bit more risk averse is the overall deal conversion rate for 2017 which, at 1.9 percent, was much lower than in previous years (Fig. 6). This could partially be due to the increased number of screened products per company (60/company in 2017 vs. 50/company in 2016), as well as fewer deals progressing to term sheet. Additionally, there are likely more companies in the mix for transactions due to the favorable financing environment. Progression to CDA rates during 2017 were similar to what we saw in 2016 but the progression to term sheets and completed transactions dropped significantly (from 38 percent to 26 percent and 37 percent to 25 percent, respectively). So, while there is apparently a lot of talking going on, issues related to strategic alignment, risk and/or due diligence are making deals harder to close. With deals failing at a later stage of the process, even after progression to term sheet, it should be a reminder for sellers not to take their eye off the ball but to be vigilant and responsive to their partner’s requests and needed until the transaction is completed, even in this very robust dealmaking environment.
Figure 6

For more on the Dealmakers’ Intentions 2018 Study, watch for the second article in this series, which will report on expectations for asset supply and demand by therapeutic area and stage of development, along with perspectives from leading dealmakers on the study’s findings and what they mean for biopharmaceutical dealmaking going forward. Follow my LinkedIn page and check back on Endpoints to find additional insights on factors impacting biopharmaceutical dealmaking.
Authors: Neel Patel is Managing Director, Commercial Strategy and Planning for Syneos Health Consulting, and Sachin Purwar is Director, Commercial Strategy and Planning for Syneos Health Consulting. Syneos Health Consulting is an industry-leading consulting firm specializing in the biopharmaceutical industry and part of Syneos Health, the only fully integrated biopharmaceutical solutions organization. We provide services across a comprehensive range of key areas, including commercial strategy and planning, medical affairs, risk and program management and pricing and market access. Recognized by Forbes magazine as one of America’s Best Management Consulting Firms for three years running, our industry focus and depth of functional expertise, combined with strong scientific and market knowledge, uniquely position us to tackle highly complex business and market challenges to develop actionable strategies for our clients. For more information, please visit syneoshealth.com/solutions/consulting.